Engineering Guide
This page is for implementation and integration engineers, covering the complete engineering process of the line-crossing statistics solution: selection, installation, configuration, data integration and daily operations. For positioning and business value, see the Solution Description.
1. Scenarios
The solution has one core action: draw a counting line in the view and count what crosses it. With the bundled person-detection model, typical scenarios include:
| Scenario | Counting criteria | Typical use |
|---|---|---|
| Store entrance | Bidirectional footfall | Staffing, merchandising, conversion analysis |
| Corridor / route | One-way or bidirectional flow | Route heat, peak-hour identification |
| Office / workshop gate | In/out statistics | On-site headcount, commute pattern analysis |
What gets counted is decided by the on-device model. Two paths to a new scenario (deployment and switching steps in 4.3):
- Ready-made models: download scenario-tuned models from the CamThink Model Zoo
- Your own models: train a detection model on field samples for special targets — see Model Training and Deployment
Site Selection
- Framing: tilt the lens down to cover the counting cross-section; keep targets large enough in the frame (too far/small causes misses); aim for even lighting and avoid backlight
- Line placement: the line crosses the counting cross-section, roughly perpendicular to the direction of travel; leave room on both sides so targets pass fully inside the frame
- Power & connectivity: realtime counting needs continuous power — prefer a Type-C power supply; choose the PoE module where Ethernet is convenient (one cable for power and data); choose Cat-1 for outdoor sites without Wi-Fi
- Install check: before fixing the bracket, confirm in the app live view that targets are large enough, the line can span the cross-section, and the direction semantics are correct (outside faces incoming targets)
2. Components (BOM)
| # | Item | Model / Spec | Qty | Purpose |
|---|---|---|---|---|
| 1 | NE301 AI camera | STM32N6, 0.6 TOPS; comm module per site: Wi-Fi 6 / Cat-1 / PoE | 1 per site | On-device detection, tracking, line-crossing counting |
| 2 | line-crossing app | .neapp app package, delivered with the solution | 1 set | Line configuration, realtime statistics, window reports |
| 3 | Power accessories | Type-C power / PoE (matched to comm module) | As needed | Camera power |
| 4 | Network accessories | Wi-Fi AP / PoE switch / SIM card (per comm module) | As needed | Camera connectivity and data backhaul |
| 5 | Business system receiver | MQTT broker (incl. MQTTS) or HTTP Webhook service | 1 set | Receives window reports |
Low-cost starting point: 1× NE301 (Type-C power + Wi-Fi) + the app package + any existing MQTT/Webhook receiver completes one site; adding sites only adds cameras — the receiver stays.
3. Network Topology
General requirements:
- Only IP reachability between camera and receiver is required; the receiver can stay on the local network (data never leaves) or integrate with the cloud as needed
- MQTT and Webhook are two independent channels, toggled separately in the app's Advanced page: use either one, or enable both for redundancy
- During outages, window reports buffer on the device within capacity and are re-sent best-effort after recovery; reports not yet delivered may be lost on power failure — for critical statistics, reconcile daily on the business side (see 5.4)
4. Setup
Follow this order: camera onboarding → app installation → model and target class → line drawing → parameters → statistics & reporting → commissioning. With the bundled person model, confirming the class in 4.3 is enough.
4.1 Camera Onboarding
- Assemble the NE301, connect power and network — see the NE301 Quick Start
- Open the camera web interface in a browser and sign in
- Confirm Application Management exists in the left navigation (i.e. the firmware includes the app host); if the firmware lacks it, flash the app-host firmware from the ne301 repository first
4.2 Install the line-crossing App
-
Download the line-crossing
.neapppackage from the ne30x-app Releases page -
Go to Application Management → ⚙ Manage App and follow the prompts to import the
.neapppackage -
After installation the app shows Installed / Running, with the live view and app UI embedded in the App Status page
-
App management actions:
| Action | Behavior |
|---|---|
| Stop | Stops the app; the app must be stopped before update or uninstall |
| Update App | Disabled while running ("The app is running, so it cannot be updated or uninstalled. Stop the app first, then try again."); normal upgrades keep business data |
| Uninstall App | Disabled while running; uninstalling also clears the app's business configuration, cumulative counts and pending reports; a reinstall starts from zero |
4.3 Set the Model and Target Class
What gets counted is decided by the on-device detection model: settle the model and target class before drawing the line. The bundled person-detection model works out of the box — for footfall counting only, confirm the target class is person and continue with 4.4; switching targets involves two steps: replacing the detection model and switching the target class, both done on the device.
Model sources and deployment
- Ready-made models: download scenario-tuned models (PT / ONNX / TFLite) from the CamThink Model Zoo
- Your own models: train a model for your scenario and targets — the full YOLO training → TFLite export → quantization → deployment flow is in Model Training and Deployment
- Deploy to the device: the Web UI upload is recommended (chapter 4 of the guide above; the model package can also be uploaded via System Settings → Firmware Upgrade); once in place, the app can bind to it
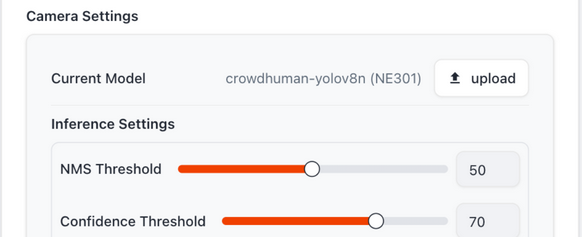
Model upload entry: Feature Debugging → Camera Settings → upload — pick the model file, and the device loads it
Setting / switching the target class (in the app)
-
Configuration page → Basic settings → Target class: the dropdown lists every class of the currently bound model; the current model name is shown below
-
Pick the new class and save — the app asks for confirmation: "Changing the target class starts a new statistics period: current window counts, totals and events will be cleared. Continue?"
-
Once confirmed it takes effect: the tracker is rebuilt around the new target and a new statistics period starts
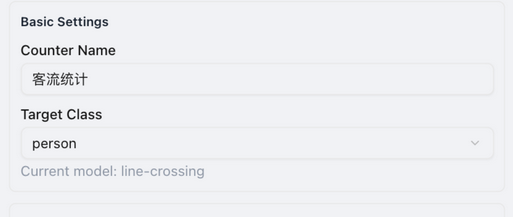
Configuration page: the Target Class dropdown lists the classes of the currently bound model; the current model is shown below
Clearing semantics of switching the target class:
| Data | After switching the target class |
|---|---|
| Window counts / totals / crossing events | Cleared; a new statistics period starts |
| Already-delivered historical window reports | Kept, unaffected |
Report sequence report_seq | Never rewinds, keeps increasing monotonically |
| Line / tracking parameters / reporting settings | Kept unchanged |
4.4 Drawing the Line and Direction
- Realtime Data page → Draw Counting Line: two clicks place the two endpoints; drag either endpoint to fine-tune (mouse and touch supported)
- IN/OUT semantics come from the line's inside/outside: a target crossing from outside to inside counts as IN, the reverse as OUT; if the direction is wrong, tap Swap IN/OUT Direction
- A mistaken line can be cleared with Reset (resets the line) and redrawn
- After saving, the configuration takes effect once validated by the device; changing the line only affects future judgement — cumulative counts are kept (to redefine the counting baseline use "Reset Statistics", see 4.7)
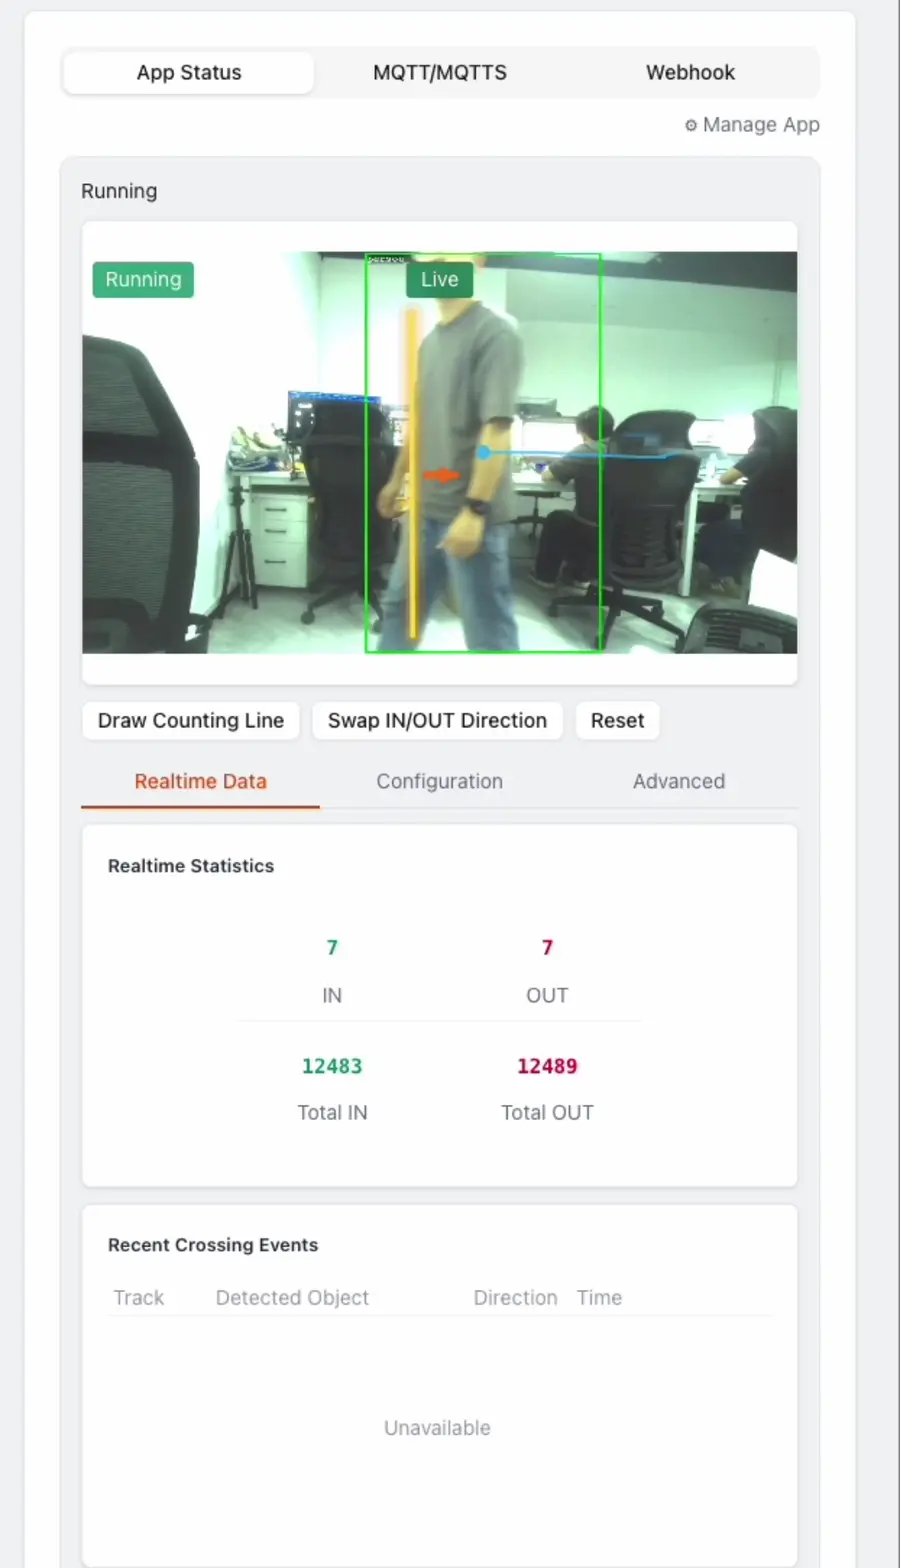
Realtime Data page: detection box, counting line, direction arrow and motion trajectory overlaid in real time
After a crossing, the statistics update immediately and the Recent Crossing Events table gains a record (track ID, detected object, direction, time):
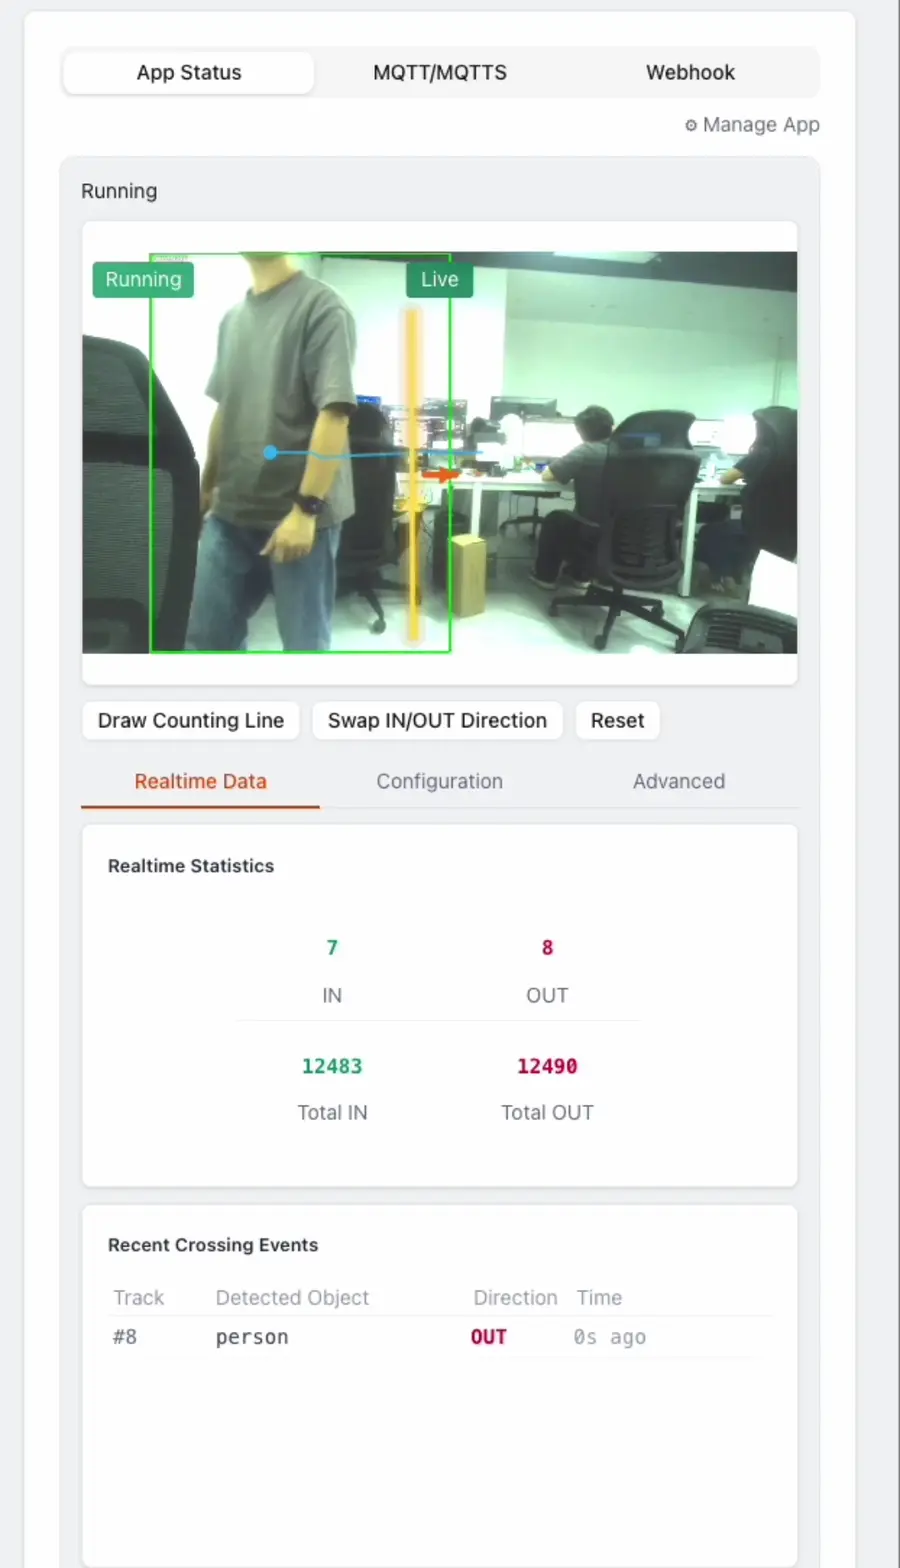
Crossing count: OUT 7→8, Total OUT 12489→12490, event #8 person OUT logged
4.5 Parameters
The Configuration page has two groups; changes apply after saving.
Basic settings
| Field | Purpose | Notes |
|---|---|---|
| Counter name | Written to counter.counter_name in reports | Name it per cross-section (e.g. "footfall"); distinguishes multiple sites |
| Target class | The bound detection target | Decided by the on-device model — see 4.3 for setting and switching; changing it clears cumulative counts and requires confirmation |
Tracking parameters (affect tracking and crossing sensitivity)
| Field | Purpose | Range | When to adjust |
|---|---|---|---|
| Confidence threshold (0-1) | Detection acceptance bar | 0–1 | False positives → raise; misses → lower |
| Association distance (0-1) | Frame-to-frame target association radius | 0–1 | Fast targets / large frame → raise; mismatched IDs → lower |
| Track history length | History points kept per track | 4–16 | Raise when crossing judgement needs smoother trajectories |
| Max lost frames | Consecutive misses a track survives | ≥1 | Raise for frequent brief occlusions to avoid double counting from broken tracks |
| Confirmation frames | Frames before a track is confirmed | ≥1 | Raise against jitter-induced false positives; lower for faster response |
Tune on site: lowering confirmation/lost frames may introduce double counting; raising them may miss fast-moving targets.
4.6 Statistics and Reporting
The Advanced page has two groups, saved independently.
App-owned settings (statistics)
| Field | Purpose | Notes |
|---|---|---|
| Statistics window (minutes) | Aggregation period of window reports | 1–1440 minutes; start with 5 minutes for footfall |
| Include tracks | Attach crossing track details to window reports | Enable when crossings need review; increases data volume |
Host-owned settings (reporting channels)
| Field | Purpose | Notes |
|---|---|---|
| MQTT reporting | Enables the MQTT channel | Server configured in the MQTT/MQTTS tab |
| Webhook reporting | Enables the Webhook channel | Server configured in the Webhook tab |
| Offline backlog capacity | Reports buffered during outages | Configurable range is device-specific; once full, new reports stop queuing |
4.7 Commissioning
- Counting: walk back and forth through the line several times at normal speed — the realtime IN/OUT statistics match, with matching records in Recent Crossing Events
- Clean baseline: before formal counting, tap Reset Statistics (dialog: "This will reset cumulative counts, events and the offline backlog. This cannot be undone. Business configuration is not affected.")
- Reporting: subscribe on the business side / check Webhook logs — window reports arrive at the configured period
- Backlog: disconnect for more than one window, reconnect, and confirm buffered reports arrive
When all four checks pass, site acceptance is complete.
5. Data Integration
5.1 Report Mechanics
- The app generates
line_countingwindow reports at the statistics period; the device sends them over MQTT / Webhook — the app never opens its own network connections - Every report carries
report_seq(monotonically increasing) andboot_id(current boot identifier): consumers deduplicate and order byboot_id + report_seq; retries or re-sends may produce duplicates - Time fields are device uptime milliseconds in the current version (
window.start_ms / end_ms), withreported_atempty — build the timeline from reception time and detect reboots viaboot_id - Offline backlog is best-effort: buffered within capacity, re-sent after recovery; requests already in flight cannot be recalled
5.2 Window Report Fields (v4.2.8)
| Field | Type | Description |
|---|---|---|
type | string | Fixed line_counting |
device_id | string | Device identifier |
app.app_id / app.sw_version | string | App identifier and version |
boot_id | number | Current boot identifier; changes on reboot |
report_seq | number | Report sequence, monotonically increasing |
clock_valid | boolean | Whether the device clock is valid (false in the current version) |
reported_at | null | Reserved wall-clock time; empty in the current version |
window.start_ms / end_ms | number | Statistics window start/end (device uptime ms) |
window.duration_sec | number | Window duration (seconds) |
window.in / window.out | number | IN / OUT counts of this window |
window.carried_in / carried_out | number | Counts accumulated before an app restart within this window, restored after the restart |
window.data_quality.complete | boolean | Whether this window's data is complete (no stream loss / dropped frames) |
window.data_quality.gaps | number | Stream interruptions within the window |
window.data_quality.lost_frames | number | Dropped frames |
window.data_quality.frames_unusable | number | Unusable frames |
total.in / total.out | number | Cumulative IN / OUT since the last reset |
counter.counter_name | string | Counter name (set in Configuration) |
target.class_name | string | Target class |
model.name / model.version | string | Currently bound detection model |
line.x1 / y1 / x2 / y2 | number | Counting line endpoints (permille 0–1000, resolution-independent) |
line.outside_x / outside_y | number | Outside reference point (permille) |
config.confidence_threshold | number | Confidence threshold when the report was generated (permille) |
5.3 Report Example
{
  "type": "line_counting",
  "device_id": "NE301-XXXXXXXX",
  "app": { "app_id": "line-crossing", "sw_version": "4.2.8" },
  "boot_id": 3,
  "report_seq": 128,
  "clock_valid": false,
  "reported_at": null,
  "window": {
    "start_time": null,
    "end_time": null,
    "start_ms": 3600000,
    "end_ms": 3900000,
    "duration_sec": 300,
    "in": 12,
    "out": 9,
    "carried_in": 0,
    "carried_out": 0,
    "data_quality": {
      "complete": true,
      "gaps": 0,
      "lost_frames": 0,
      "lost_unknown": false,
      "frames_unusable": 0,
      "persist_ok": true
    }
  },
  "total": { "in": 1246, "out": 1180 },
  "counter": { "counter_name": "客流统计" },
  "target": { "class_name": "person" },
  "model": { "name": "line-crossing", "version": "1.0.0" },
  "line": {
    "x1": 420, "y1": 800, "x2": 580, "y2": 800,
    "outside_x": 500, "outside_y": 1000
  },
  "config": { "confidence_threshold": 500 }
}
All values in the example are illustrative; the field structure matches app v4.2.8 and may evolve in later versions — refer to the field documentation of your delivered version.
5.4 Consumer Recommendations
- Deduplication / idempotency:
boot_id + report_sequniquely identifies a report; dedupe on this key - Timeline: align windows to reception time or business-side clocks; unify to wall-clock time when aggregating multiple sites
- Quality filter: windows with
data_quality.complete = falseare for alerts and review — keep them out of official reports - Daily reconciliation: compare the daily
totalagainst summed windows to detect missing or dropped reports
6. Daily Operations
| Symptom / task | Action |
|---|---|
| Check running status | Application Management → App Status: app state and realtime statistics on one screen |
| Live view not showing | The video area shows its own state (Live / Reconnecting / Unavailable), independent of app status; check the network first |
| Change configuration | Edit on Realtime Data / Configuration / Advanced and save; line and parameter changes keep cumulative counts |
| Start a new counting baseline | Reset Statistics (clears totals, events and backlog; configuration kept; irreversible) |
| Update the app | Stop the app first → Update App; normal upgrades keep business data |
| Start over | Stop the app → Uninstall App (also clears all of the app's business data; reinstall starts from zero) |
| False / missed counts | Check line placement and direction (4.4); tune tracking parameters per 4.5; if needed, train a model on field samples and switch the target class to improve accuracy (see 4.3) |
7. Performance and Specifications
| Item | Value |
|---|---|
| Bundled model | Person detection, delivered with the app |
| Custom models | Download examples from the CamThink Model Zoo; deploy self-trained models per Model Training and Deployment |
| Statistics window | Configurable, 1–1440 minutes |
| Counting line | 1 per app, coordinates in permille 0–1000 |
| Cumulative baseline | Survives power loss; cleared by Reset Statistics or a target class change |
| Offline backlog | Configurable capacity, actual limit is device-specific; best-effort resend after recovery |
The solution targets traffic-trend analysis rather than metering-grade precision: accuracy depends on mounting angle, lighting and target density, and can be improved iteratively by training on field samples — always validate on site.
8. Support
- Community: Discord / GitHub Discussions
- Custom solutions & volume deployment: Contact us, mentioning site count and the integration interface of your existing system