Dashboard
This is the entry page of the User Guide. Every NE503 feature is accessed through the web console — learn the Dashboard layout here, then dive into the chapters you need.
Dashboard Panel
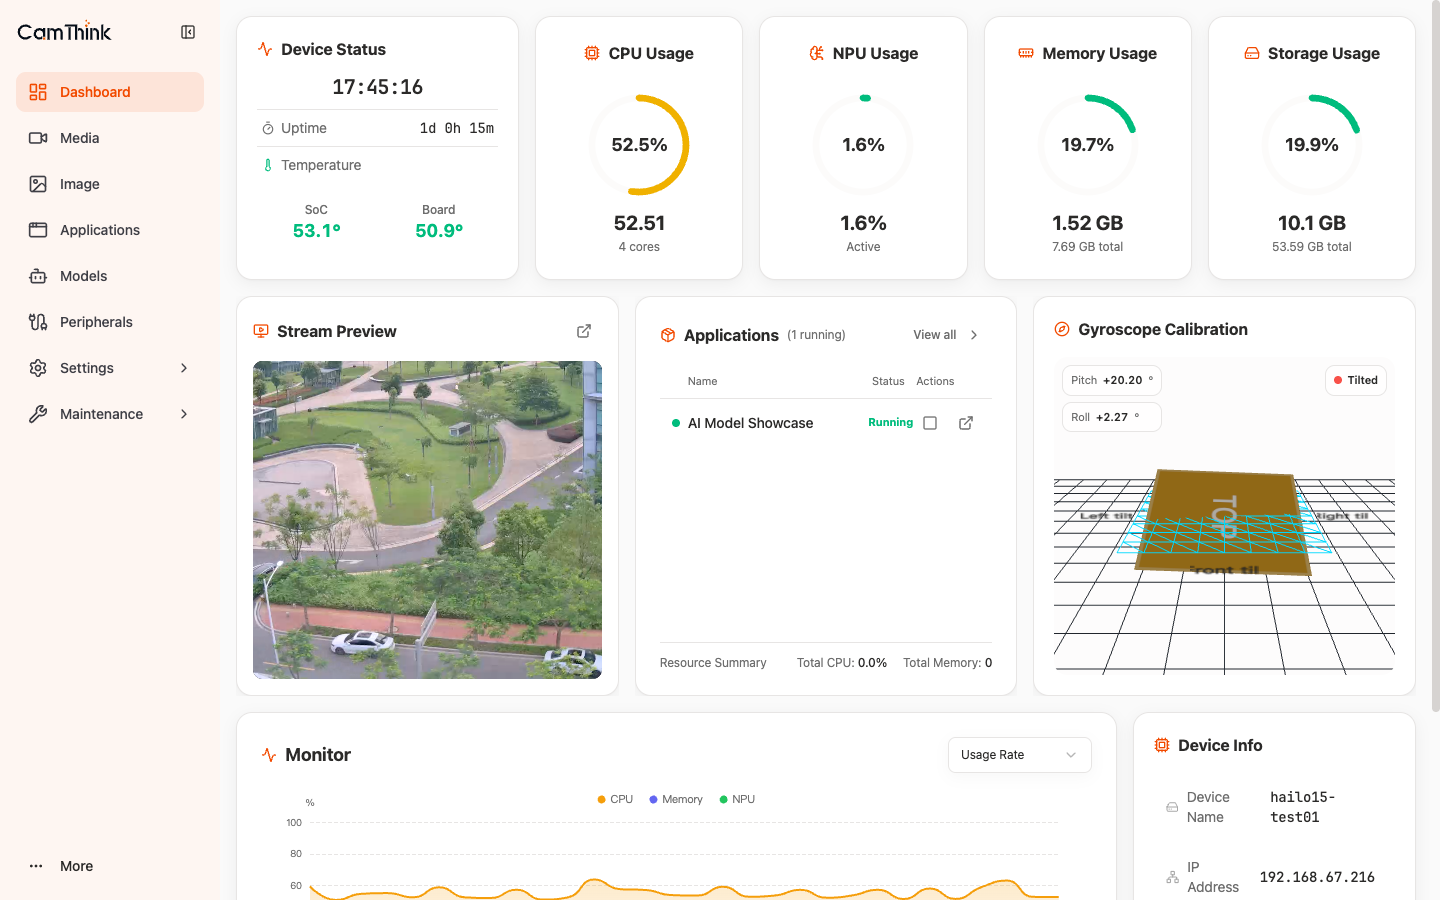
The Dashboard is the landing page after login — a single screen to gauge device status at a glance. It is arranged in three rows from top to bottom:
- Row 1 — Device Status (time / uptime / temperature) on the left, four resource gauges (CPU / NPU / Memory / Storage) on the right
- Row 2 — Stream Preview, Applications, and Gyroscope Calibration
- Row 3 — Monitor (resource trend chart) and Device Info
The sections below explain what each panel shows and what to watch for.
Device Status
Current device time, Uptime (continuous run time since last boot), and Temperature (SoC and board readings). Temperature is the key indicator for cooling and workload — if SoC stays above 80°C, check the ventilation of the installation or reduce running models / apps.
Resource Monitoring
Four real-time gauges — the first reference for whether the device can keep up with its workload:
| Metric | Meaning | Watch for |
|---|---|---|
| CPU Usage | Processor utilization (4 cores) | Sustained > 80% means app load is heavy; consider stopping non-essential apps |
| NPU Usage | AI inference unit utilization | Correlates with the number of running models; check here first if inference slows down |
| Memory Usage | Memory used / total | Near the limit, containers may get OOM-killed; watch for apps that restart unexpectedly |
| Storage Usage | Storage used / total | Above 80%, clean up recordings / logs or expand |
Stream Preview
A thumbnail of the live camera feed — seeing the image confirms that the sensor and image pipeline are working. Click Go to Media to open the Media page for the full view and stream parameters.
Applications
Lists currently running container apps with their status and resource usage, plus a resource summary at the bottom. Click View all to open the Applications page to install / start / stop / uninstall.
Gyroscope Calibration
Shows the device's real-time Pitch and Roll angles, plus the level status (Leveled / Tilted). Two uses:
- Installation angle check: after mounting, glance at the angles to confirm the tilt is as intended
- Electronic Stabilization (EIS): the Image page's EIS relies on gyroscope data; an abnormal attitude degrades stabilization
Monitor
A trend chart of resource usage over time. Switch between CPU / NPU / memory and other metrics via the dropdown at the top. Use it to spot periodic load patterns or pinpoint when a stutter or frame drop occurred.
Device Info
A summary of device name, IP, MAC, firmware version, and build date — the basic information to give support when troubleshooting.