Data Push
Data Push automatically sends NeoMind device telemetry to external systems — either the moment a device publishes new data or on a fixed interval, to a Webhook endpoint or MQTT Broker you configure. Typical uses:
- Forward sensor data to an enterprise data platform / data lake
- Sync device state in real time to third-party monitoring systems (e.g. Grafana, ThingsBoard)
- Push AI inference results to a business system to trigger downstream workflows
- Bridge NeoMind to another IoT platform
Data Push lives under the Push tab on the Data Explorer page, complementing Rules (condition-triggered actions) and Data Transforms (real-time data processing).
Interface Overview
Open Data Explorer (database icon) in the left nav and switch to the Push tab:
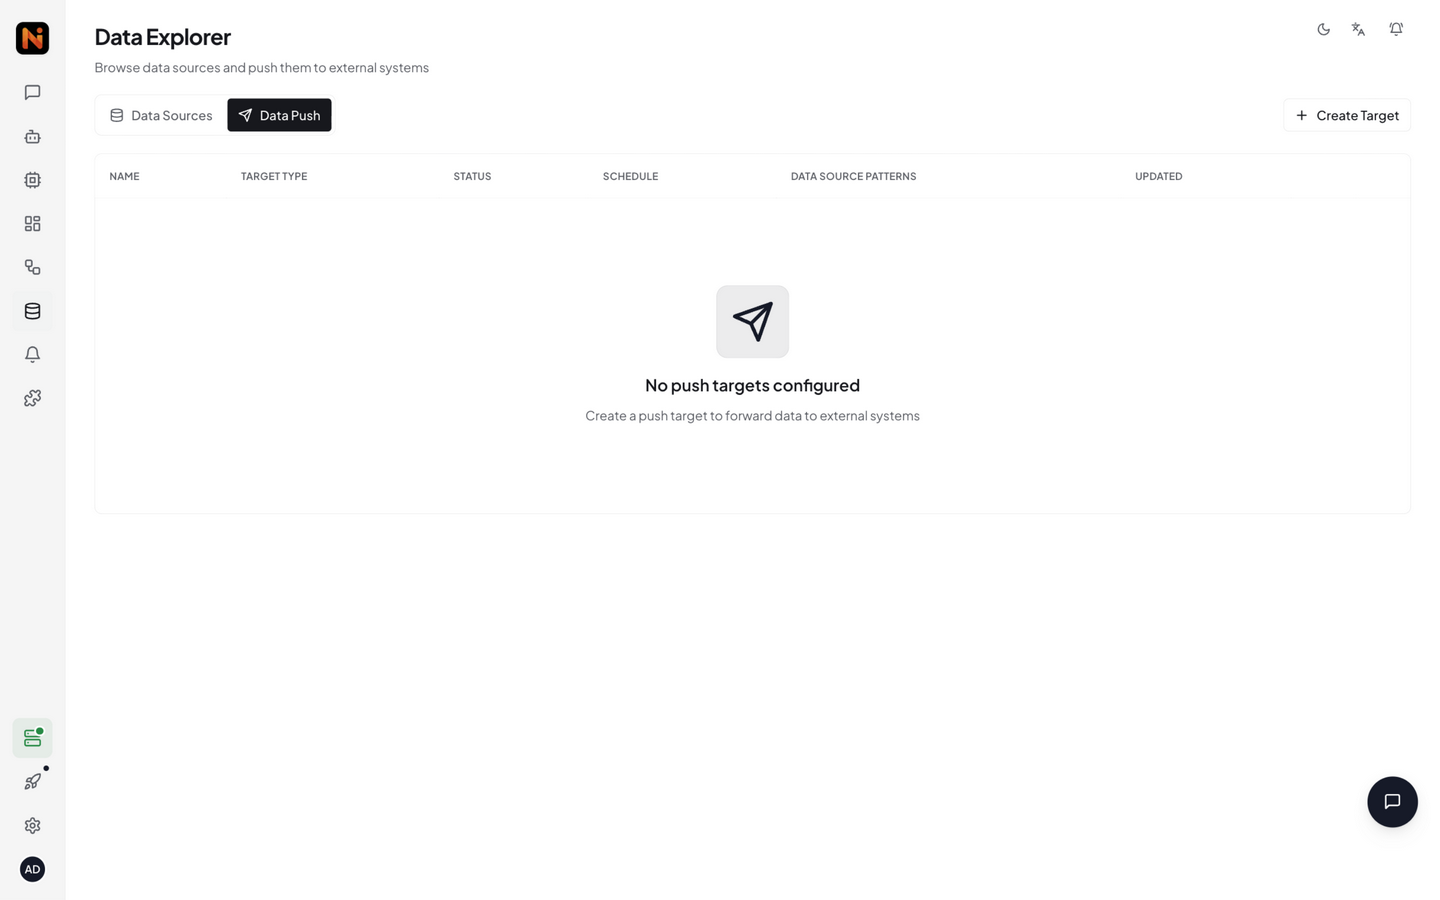
The page lists all push targets in a table, each row containing:
| Column | Description |
|---|---|
| Name | Display name of the push target |
| Type | Webhook / MQTT |
| Status | Running / Stopped |
| Schedule | Event Driven / Interval |
| Data Sources | Matched source patterns (e.g. device:sensor-01:*) |
| Updated | Last modified time |
| Actions | Edit, delete, test, view logs |
Creating a Push Target
Click Create to open the full-screen configuration dialog:
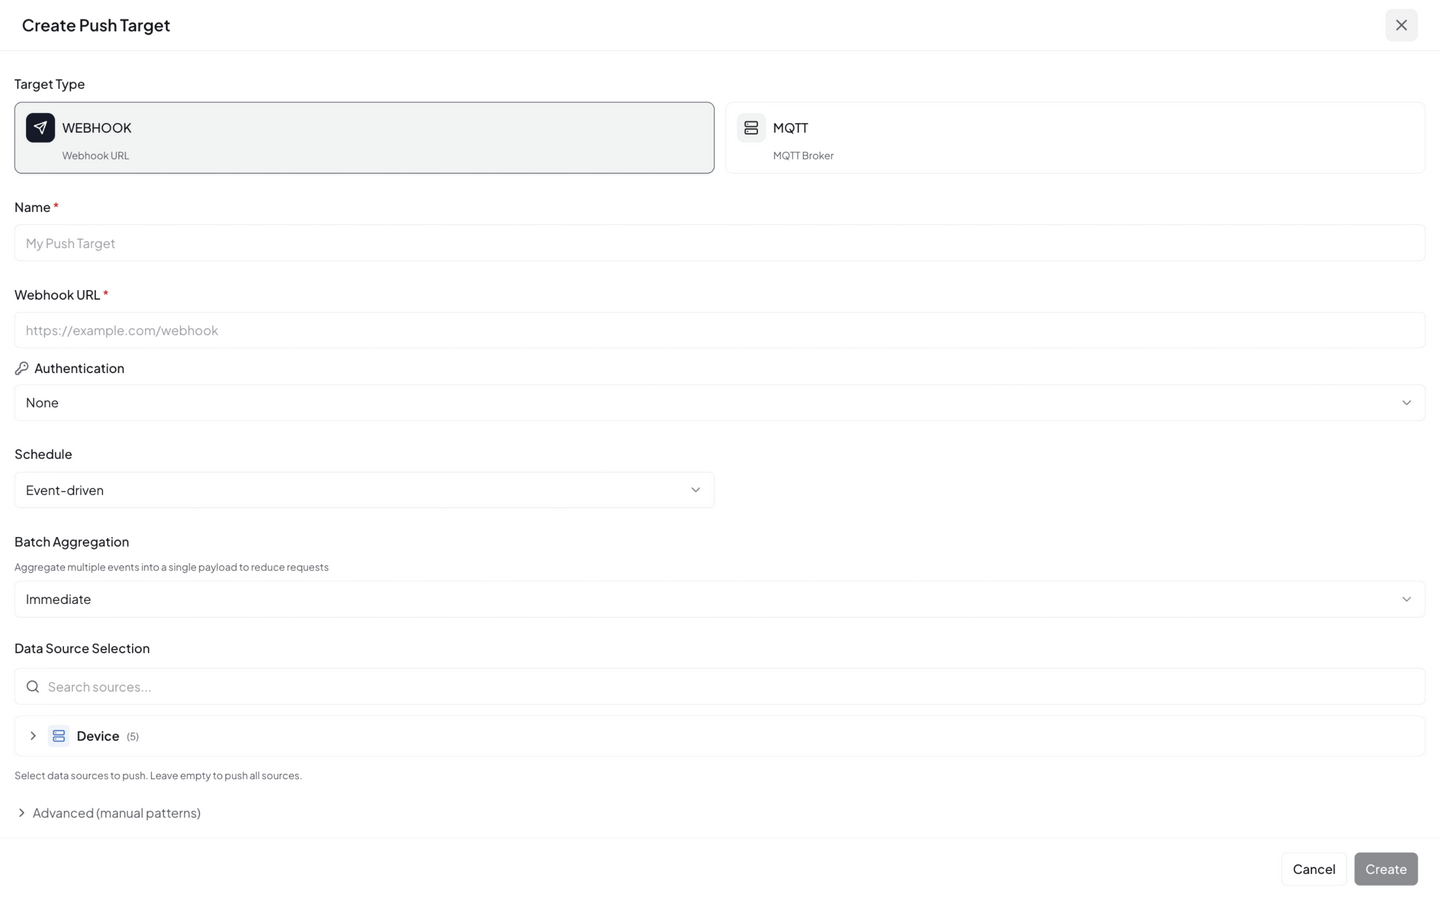
1. Basic Info
| Field | Description |
|---|---|
| Name | Identifier for the push target |
| Target Type | Webhook — HTTP POST to a URL; MQTT — publish to an MQTT Broker |
2. Target Configuration
Webhook type:
| Field | Description |
|---|---|
| URL | HTTP endpoint that receives data (e.g. https://api.example.com/ingest) |
| Method | HTTP method (default POST) |
| Headers | Custom request headers (e.g. Authorization: Bearer <token>, Content-Type: application/json) |
MQTT type:
| Field | Description |
|---|---|
| Broker | MQTT Broker host (e.g. broker.example.com; port is a separate field, default 1883) |
| Topic | Publish topic (e.g. factory/line1/sensors) |
| Username / Password | Authentication credentials (optional) |
3. Schedule
| Schedule type | Description | Use case |
|---|---|---|
| Event Driven | Push as soon as new data arrives | Real-time sync, low-latency scenarios |
| Interval | Batch push every N seconds | Reduce request frequency, batch scenarios |
4. Data Source Filter
Choose which data sources to push:
| Setting | Description |
|---|---|
| Source Patterns | Wildcard matching. device:sensor-01:* = all metrics of sensor-01; device:sensor-01:temperature = sensor-01's temperature metric. Note: patterns match by prefix — a * in the middle has no effect (device:*:temperature actually matches all device data) |
| Only Changes | When enabled, pushes only when the data value actually changes, skipping duplicates to reduce traffic. Configured via the API's data_filter.only_changes field (the create dialog doesn't expose this toggle yet; off by default) |
The source panel is grouped by type (Device / Extension / Transform / System) with search and multi-select.
5. Retry & Batch
Retry Config — configured via the API's retry_config field; when omitted, the following defaults apply:
| Field | Description | Default |
|---|---|---|
| Max Retries | Maximum retry attempts | 3 |
| Backoff (secs) | Initial backoff seconds | 5 |
| Max Backoff (secs) | Maximum backoff cap | 300 |
Retry uses exponential backoff: 1st retry waits 5s, 2nd 10s, 3rd 20s … up to the Max Backoff cap. Note that
Max Retries: 3counts retries — including the initial send, one data point gets at most 4 attempts. If the target replies with 429/503 (rate limiting), NeoMind switches to a longer fixed backoff and honors theRetry-Afterresponse header when present (defaulting to 60 seconds without it), so an already-throttled endpoint isn't hammered further.
Batch Config:
| Field | Description |
|---|---|
| Batch Size | Maximum items per batch (default 1, i.e. no batching — push each item immediately) |
| Batch Interval (ms) | Batch send interval in milliseconds (default 2000) |
With batching enabled (batch_size > 1), multiple data points are accumulated into one request with the payload shape { "batch": […], "count": N, "items": [{"source_id", "value", "timestamp"}, …] } (format: "flat", the default; format: "nested" organizes items nested by source type / ID / field instead).
Click Save when done.
Complete Lifecycle Example: Webhook from Creation to Verification
Walk the whole flow with real requests/responses: pushing sensor-01's data to a local receiver.
Step 1 · Create the push target
curl -X POST http://localhost:9375/api/data-push \
  -H "Authorization: Bearer <JWT>" \
  -H "Content-Type: application/json" \
  -d '{
    "name": "Temperature to Local Receiver",
    "target_type": "webhook",
    "config": {"url": "http://192.168.1.50:9999/ingest", "method": "POST"},
    "schedule": {"type": "event_driven", "event_types": ["device_metric"]},
    "data_filter": {"source_patterns": ["device:sensor-01:*"], "only_changes": false},
    "enabled": true
  }'
Real response:
{
  "success": true,
  "data": {
    "id": "f95bd869-0acb-41d2-a75a-a8c879d53f99",
    "name": "Temperature to Local Receiver",
    "target_type": "webhook",
    "enabled": true
  }
}
Note: an event-driven schedule must include event_types (e.g. device_metric for device data, extension_output for extension output); interval scheduling instead uses {"type": "interval", "interval_secs": 60}.
Step 2 · Start and send test data
# Start
curl -X POST http://localhost:9375/api/data-push/<id>/start

# Push one sample payload to verify the pipeline
curl -X POST http://localhost:9375/api/data-push/<id>/test
Step 3 · Confirm what the receiver got
test makes NeoMind actually POST a sample payload to the target URL. The HTTP request as received on the other side:
POST /ingest
Content-Type: application/json

{"source_id":"test:sample:value","value":{"test":true,"value":42},"timestamp":1788930335}
That is, the default payload always has three fields: source_id (data source ID), value (metric value — scalar or object), timestamp (Unix seconds). When real device data flows, source_id is the matched data source (e.g. device:sensor-01:temperature) and value is the metric value.
If the receiving side needs a different shape, use the target's template field — a Handlebars template with access to source_id / value / timestamp, plus two helpers: {{json value}} (serialize to a JSON string) and {{timestamp_format …}} (format a timestamp):
{ "template": "{ \"device\": \"{{source_id}}\", \"reading\": {{json value}}, \"time\": {{timestamp}} }" }
Step 4 · Check the delivery log
curl http://localhost:9375/api/data-push/<id>/logs
A real delivery log entry (produced by test):
{
  "id": "d9c8122f-2419-42a2-a45c-66eea410ec43",
  "target_id": "f95bd869-0acb-41d2-a75a-a8c879d53f99",
  "status": "success",
  "data_source_id": "test:sample:value",
  "payload_sent": "{\"source_id\":\"test:sample:value\",\"value\":{\"test\":true,\"value\":42},\"timestamp\":1788930335}",
  "response": null,
  "attempts": 1,
  "created_at": 1788930335,
  "completed_at": 1788930335,
  "error": null
}
Field-by-field meanings are in Delivery Logs.
Step 5 · Check aggregate stats
curl http://localhost:9375/api/data-push/stats
{
  "success": true,
  "data": {
    "total_targets": 1,
    "active_targets": 1,
    "total_deliveries": 0,
    "successful_deliveries": 0,
    "failed_deliveries": 0
  }
}
The delivery counters accumulate as real data is pushed — if failed_deliveries climbs, go to Delivery Logs and read the error field to find out why.
Push Target Actions
Each push target supports the following actions:
| Action | Description |
|---|---|
| Start / Stop | Start / stop the push |
| Test | Send a test payload to verify the connection |
| Logs | View delivery logs (success / failure / retries) |
| Edit | Edit the configuration |
| Delete | Delete the push target |
Delivery Logs
Click Logs on a push target (or GET /api/data-push/<id>/logs) to view delivery history. Fields per entry:
| Field | Description |
|---|---|
id | Log entry ID |
target_id | The push target this entry belongs to |
status | pending / success / failed / retrying |
data_source_id | The pushed data source ID (e.g. device:sensor-01:temperature) |
payload_sent | The exact payload sent (after template rendering) |
response | The response body returned by the target (truncated; useful to confirm how the receiver processed it) |
attempts | Actual attempt count — 1 means first-try success; >1 means retries happened |
created_at / completed_at | Unix timestamps of delivery start and final completion (or giving up) |
error | Failure reason (target 5xx, connection timeout, TLS errors, etc.) |
Debugging recipe: for status: failed, read error first; a large attempts count means an unstable target, and the created_at/completed_at delta tells you how long retries dragged on; diff payload_sent byte-for-byte against receiver-side logs to settle "what was actually sent".
MQTT Target Differences
Choosing the MQTT type changes the configuration and delivery behavior in these ways:
| Dimension | Webhook | MQTT |
|---|---|---|
| Target config | url + method + headers | broker (hostname) + port (separate field, default 1883) + topic (publish topic) + optional username / password |
| Extra parameters | — | qos (default 1), client_id (defaults to neomind-push) |
| Delivery | One HTTP POST per push | Publishes one message to the topic; payload identical to Webhook (default {"source_id", "value", "timestamp"}, template also supported) |
| Connection model | Stateless — connect, send, disconnect | Persistent connection to the Broker; unreachable Brokers are retried per the retry policy |
| Testing | Test issues a real POST | Test actually publishes to the topic (verify with a client like mosquitto_sub -t '<topic>') |
| Best for | REST business systems, data platform ingest APIs | Platforms with existing MQTT infrastructure (ThingsBoard, EMQX, …) |
NeoMind ships an embedded MQTT Broker (default port 1883) — device data already flows in through it. Pointing a push target at the local broker on a different topic creates a "data loopback" that gives MQTT-only external programs the same stream as the platform internals.
CLI Management
# List all push targets
neomind push list

# Create a push target (webhook / mqtt; --config takes the target config JSON)
neomind push create --name "Temperature to API" --type webhook \
  --config '{"url":"https://api.example.com/ingest","headers":{"Content-Type":"application/json"}}'

# Start / stop
neomind push start <target_id>
neomind push stop <target_id>

# Test push
neomind push test <target_id>

# View delivery logs / stats
neomind push logs <target_id>
neomind push stats

# Delete
neomind push delete <target_id>
REST API
# Create push target (event-driven schedule requires event_types; interval uses {"type": "interval", "interval_secs": 60})
curl -X POST http://localhost:9375/api/data-push \
  -H "Content-Type: application/json" \
  -d '{
    "name": "Temperature to API",
    "target_type": "webhook",
    "config": {"url": "https://api.example.com/ingest", "method": "POST"},
    "schedule": {"type": "event_driven", "event_types": ["device_metric"]},
    "data_filter": {"source_patterns": ["device:*:temperature"], "only_changes": false},
    "enabled": true
  }'

# List all push targets
curl http://localhost:9375/api/data-push

# Start push
curl -X POST http://localhost:9375/api/data-push/<id>/start

# Test push
curl -X POST http://localhost:9375/api/data-push/<id>/test

# View delivery logs
curl http://localhost:9375/api/data-push/<id>/logs

# View stats
curl http://localhost:9375/api/data-push/stats
Typical Scenarios
Scenario 1: Real-time Temperature Push to Enterprise API
- Type: Webhook
- Schedule: Event Driven (push on new data)
- Source:
device:*:temperature(prefix-matched — effectively all device data; listdevice:<id>:temperatureper device to target the metric precisely) - Only Changes: enabled (avoid duplicate values)
- Retry: 3 attempts, exponential backoff
Scenario 2: Batch Sync Device Status to MQTT Broker
- Type: MQTT
- Schedule: Interval, every 60 seconds
- Source:
device:*:online - Batch: 100 items per batch, 5-second interval
- Only Changes: enabled (push only state changes)
Scenario 3: Push AI Inference Results to Business System
- Type: Webhook
- Schedule: Event Driven
- Source:
extension:yolo-video:detections - Target URL: The business system's ingest endpoint
Integration with Other Modules
| Module | Description |
|---|---|
| Devices | Push raw telemetry published by devices |
| Data Transforms | Push derived metrics generated by Transforms |
| Extensions | Push metrics output by extensions (e.g. YOLO detections) |
| Rules | Rules evaluate data internally; Push sends data externally |
Best Practices
- Enable Only Changes: For state-like data (e.g.
online), this drastically cuts redundant pushes - Batch wisely: High-frequency data should use Interval + batch to avoid request storms on the target system
- Configure retry: With network instability, 3 exponential-backoff retries cover most transient faults
- Test before enabling: After creating, use Test to verify the connection works before starting the push
- Monitor delivery logs: Periodically review failed logs to catch target-system issues early
Next Steps
- Notifications & Messages — Data Push handles data streams; the message system handles alert streams
- Automation Rules — Evaluate data in-platform and trigger actions
- Troubleshooting — General debugging steps when pushes fail
Last updated: 2026-09-09